

Fanuc diagnostic trace function setup for CNC's
When should you use a trace for troubleshooting fanuc controls?
Diagnostic trace functions are usually only used when problems are intermittent and difficult to track down. They typically are used as a last resort when the problem either does not get worse enough to make for easy troubleshooting. Traces can be somewhat difficult to understand and get good results if you do not understand how they function or understand ladder logic to confirm results are accurate based on machine conditions. But it is also a great tool that can be used while the machine is running and making parts to further diagnose a machine problem.
To start you must learn how to set PMC type, address, and mask data to utilize the Fanuc trace function. When entering addresses to watch you sill specify a base address. For example. X100. X100 actually will have at least 7 bits. such as X100.0, X100.1, X100.2..........etc. In order to watch only specific bits. Such as X100 bit 1 and bit 2. You will need to set a mask of 06 (see chart below). Then after pressing start/exec. The trace will run. You usually have to start the machine or run a certain section of the machine. Such as a tool change, pallet change or whatever you are trying to troubleshoot.
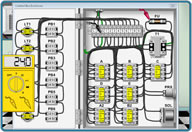
To bring up the trace function on a fanuc CNC control
Press PMC softkey
Press PMCDGN softkey
Press Trace softkey
Trace Mask Data determination chart
Bits are numbered in this order 7654 3210
For example PLC bit X100.1 is the red number-7654 3210
If you wanted to watch X100.1 and X100.7 the mask would be 80(for bits 7654) 02 (for bits 3210). Data entered in mask would then be 8020.
This chart simplifies setting up a trace on a fanuc control.
| Trace Mask Data | Bit(s) you would like to watch |
01 02 03 04 05 06 07 08 09 0A 0B 0C 0D 0E 0F |
0 |
10 20 30 40 50 60 70 80 90 |
4 5 4,5 6 4,6 5,6 4,5,6 7 7,4 |
A0 |
7,5 |
How to analyze the diagnostic PLC trace data results on a fanuc control.
The way the trace works is when an input that you designated to watch changes state either to a 1 or 0 it will record the data and drop one line in the trace data. When an alarm occurs or whatever you are trying to determine where a problem is you can then look at the trace data. What you will be looking for is a pattern in the bits that is different from the previous cycle. For example. Lets say you run one tool change in MDI. Look before running the tool change as to what line the trace is on. Then run a complete tool change. Then look to see what line it is on. Lets say the trace moved 5 lines. Look at that pattern. Then run some more and look for either more or less inputs being turned on. Many times a prox may go on then off then on if its reading something that is worn, misadjusted or loose. This is typically a condition that you want to set up a trace. Usually intermittent problems.
Another function similar to the trace function is the fanuc trigger function. which will latch and memorize a rung status when triggered.
Fanuc trace and trigger function is only available on 16,18,21 or higher controls CNC controls